We have so much data at our fingertips these days.
Our smartphone tells us how many steps we’ve taken.
Our Apple watch gives us a heart rate reading anytime we wish.
Our financial tracking software shows us realtime in and out movements of money and how the business is faring in each moment.
We can track every tick of the stock market.
I can see incredible amounts of live, up-to-the-moment analytics about videos I post on YouTube.
Even when I ride my bike, I can see how many watts of power I’m outputting displayed on my bike computer as I ride, it connects wirelessly to my heart rate monitor and displays that BPM number, I can see my speed, how many feet of elevation I’ve climbed, my average MPH and all these numbers are constantly updating every single moment.
Data, data, data everywhere we look.
But if we take each piece of data based solely on the piece of data we saw just before it and make our judgment, we will transform our lives into jagged and over reactionary lives of misery. Always a slave to the whims of the noise of data.
So what if my heart rate is 2BPM higher than normal. I’ll be concerned if it’s 20BPM higher. So what if the business is running at a net loss today, weekends are when we make our money. So what if the daily views are down 3%, tomorrow they could be up 12%.
Instead of hanging on the moment by moment noise of data, watch for the big changes only. Ignore the small stuff.
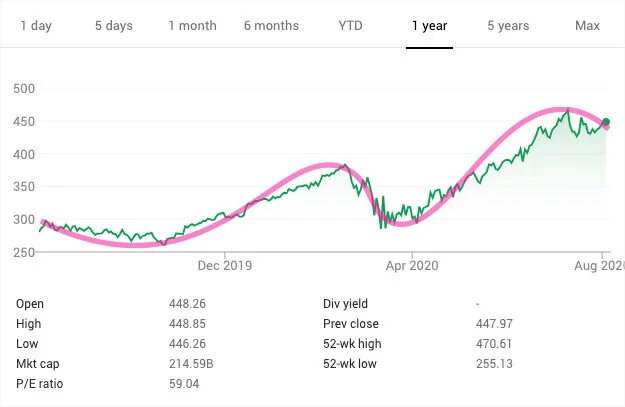
If you draw a graph and mark some business or personal data change every hour, you will end up with a jagged bumpy graph line (representative of the turmoil you feel by constantly examining this data stream), but if you ignore all the little changes bu drawing a smoothed line that generally follows the course of the jagged graph line, you will see a more simple and smooth output of the data.
One that ignores the noise and presents a less volatile picture of our data.